Q2 2025 Recap & Q3 2025 Outlook
Key Updates on the Economy & Markets
After a volatile start to the year, the stock market staged a strong rebound over the last three months. In Q1, market sentiment was cautious due to rising policy uncertainty, concerns about slower economic growth, and questions about the longer-term outlook in the artificial intelligence industry. In Q2, caution gave way to renewed optimism as tensions eased, tariffs had a limited economic impact, and companies posted stronger-than-expected Q1 earnings. The dramatic shift in sentiment across the quarters created two distinctly different market environments.
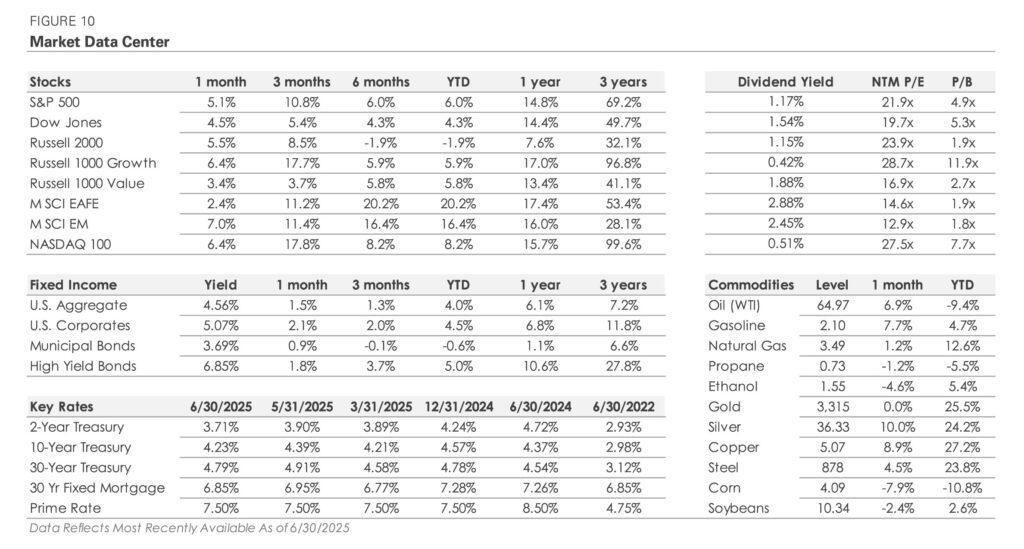
The first half of 2025 was busy and eventful, but for all that happened, markets ended the first half not far from where they started the year. The S&P 500 returned +6.1% through the end of June after being down over -15% at one point, and it trades at a similar valuation to the start of the year. Long-term interest rates, as measured by the 30-year U.S. Treasury bond yield, ranged from 4.40% to 5.10% but ended the first half of the year near 4.80%, where it started. For those not closely following the markets, it may seem as though little has changed. In this letter, we recap the second quarter, discuss the changes in market conditions from Q1 to Q2, and look ahead to the second half of 2025.
Markets Ride a Wave of Policy Uncertainty
Significant and frequent shifts in U.S. trade policy have characterized this year. There were periods of increasing tariffs and targeted actions against trading partners, followed by exemptions and temporary agreements. While the first quarter was marked by trade escalation, the second quarter saw a significant shift toward de-escalation.
The escalation began in February and March with targeted tariffs on imports from China, Canada, and Mexico, as well as broader duties on global steel, aluminum, and automotive imports. Tensions peaked in early April with the announcement of sweeping tariffs on most imports. However, the tone quickly shifted a week later toward de-escalation when the administration paused reciprocal tariffs for all trading partners except China. By early May, the White House announced a trade agreement with China, signaling a further easing of tensions.
While Q2’s de-escalation efforts lowered tariffs from the initial extreme levels, uncertainty remains. In late May, a U.S. trade court ruled the tariffs unconstitutional, and by early June, the administration was weighing new tariff actions. As July and August deadlines on tariff exemptions approach, the policy environment remains fluid, with several key details still unresolved.
Monitoring Tariffs’ Early Economic Impacts
Trade policy uncertainty impacted economic data and temporarily boosted activity early this year, as businesses and consumers rushed to buy goods ahead of anticipated tariffs. The front-running behavior was evident in Q1, with monthly imports of consumer goods and industrial supplies rising. Separately, auto-related tariffs led to a surge in vehicle sales in March and April. The spikes don’t appear to be seasonal but rather a response to anticipated tariff changes, suggesting businesses and consumers pulled forward purchases to avoid potential cost increases.
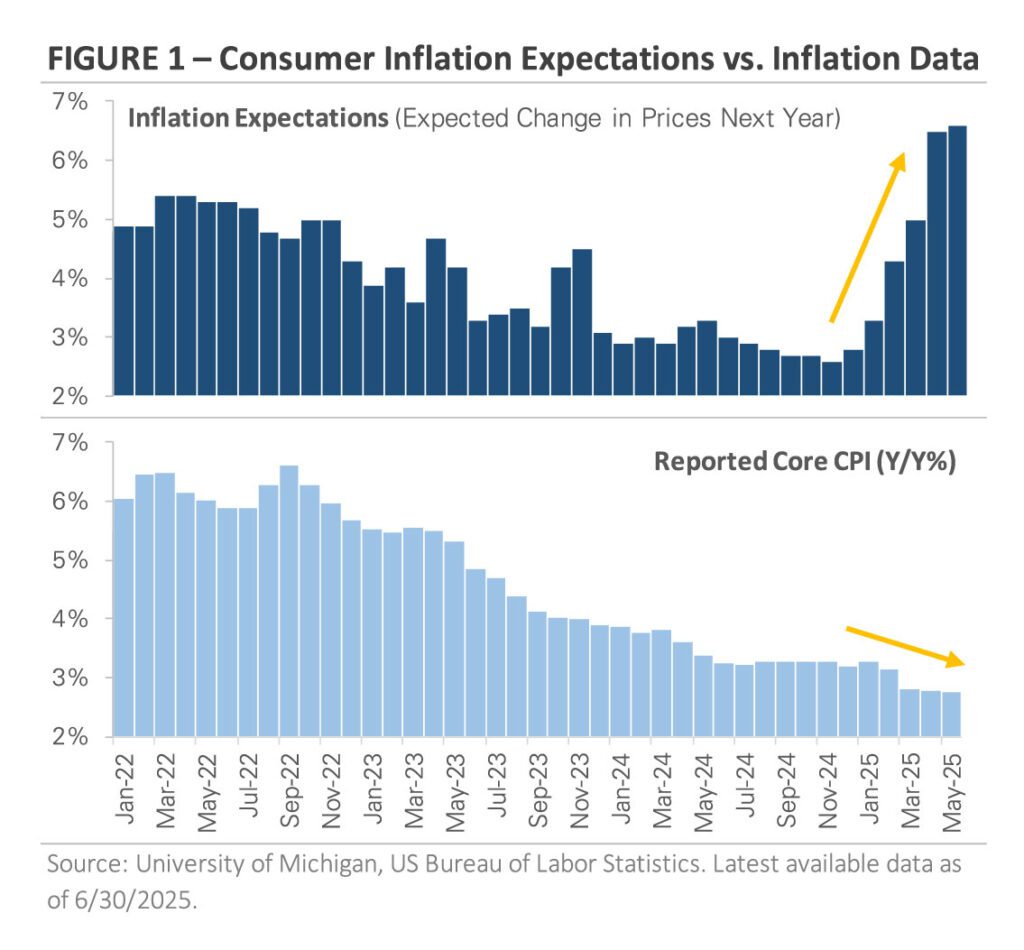
Tariff uncertainty also caused inflation expectations to rise, despite actual inflation remaining subdued. The two charts in Figure 1 highlight the growing gap between consumer expectations and trailing inflation data. The top chart, based on University of Michigan survey data, shows a sharp rise in inflation expectations this year. In contrast, the bottom chart, which graphs the Consumer Price Index, shows prices continuing to drift lower. The divergence highlights that while consumers are bracing for higher prices, actual inflation data shows tariffs have not translated into measurable price pressures thus far.
Early inflation readings have been encouraging, but concerns remain about the potential inflationary impact of tariffs. Economists caution that May’s inflation report may not fully capture the impact of the tariffs, as it takes time for supply chains to adjust. This has sparked a debate about the path forward: one group believes companies will raise prices and pass-through tariffs, while the other thinks firms will absorb the higher costs to remain competitive. The upcoming corporate earnings season will provide an early glimpse into how companies are navigating tariffs and policy uncertainty, including updates to their pricing strategies and earnings guidance for the coming quarters.
Federal Reserve Urges Patience Due to Uncertainty
Tariffs and trade policy uncertainty have also influenced Fed policy. The central bank faces a difficult policy tradeoff: tariffs could lead to higher inflation, but they could also slow economic growth if higher prices reduce demand for goods and services. Given the uncertainty, the Fed held interest rates steady at its May and June meetings, reiterating that it wants more data before deciding on interest rate cuts.
The market has adopted the Fed’s wait-and-see approach. Figure 2 graphs the market’s rate cut forecast through the end of 2026, based on current fed funds futures pricing. The Fed’s current target range is 4.25%–4.50%. The chart indicates that the market anticipates a gradual near-term decline in rates, with the first expected cut scheduled for September. The pace of rate cuts is then forecast to increase in Q4 and continue throughout 2026. Looking ahead to December 2026, the market expects the Fed to lower interest rates by approximately -1.25% over the next 18 months.
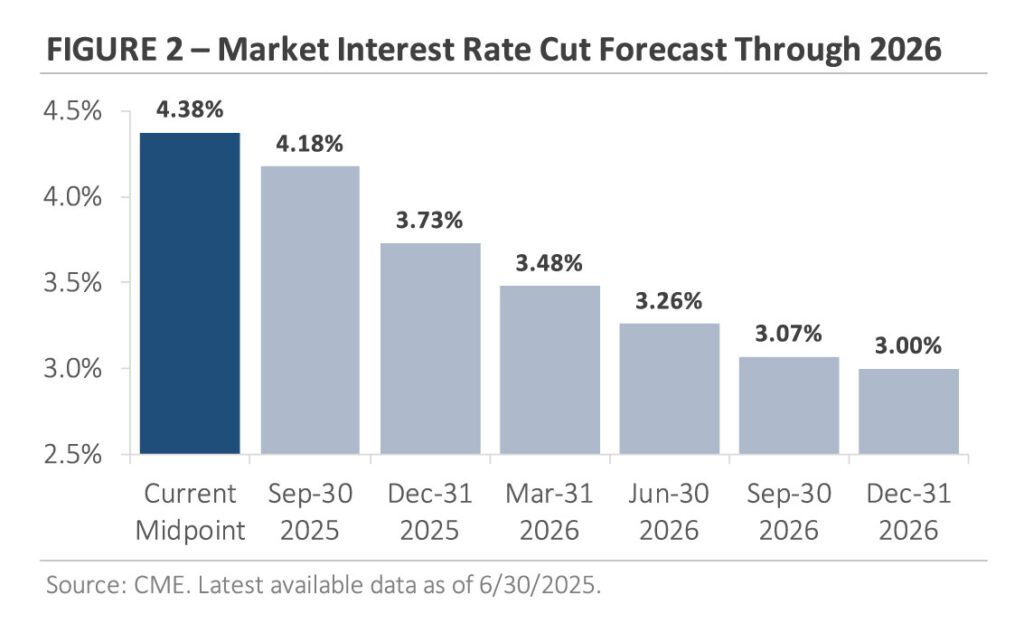
Based on this current market pricing, investors expect the Fed to lower interest rates at a modest pace. This likely reflects the inflationary risk from tariffs, as well as their limited economic impact thus far. It’s essential to note that the market’s forecast is likely to change as more data becomes available, with the timing and size of rate cuts contingent upon inflation, trade policy developments, and the economy’s trajectory over the next several quarters.
Stock Market Rebounds as Valuations Expand
While the Fed paused its rate-cutting cycle due to policy uncertainty, the stock market has taken the view that tariffs will have a modest and temporary impact. Figure 3 provides context around the Q1 selloff and Q2 rebound. The dashed light blue line graphs the rolling 12-month earnings estimate for the S&P 500, showing Wall Street analysts’ profit expectations for the year ahead. The dark navy line graphs the S&P 500’s price-to-earnings (P/E) multiple, or how much investors are willing to pay for those future earnings. The combination of earnings and valuations determines the S&P 500’s price.
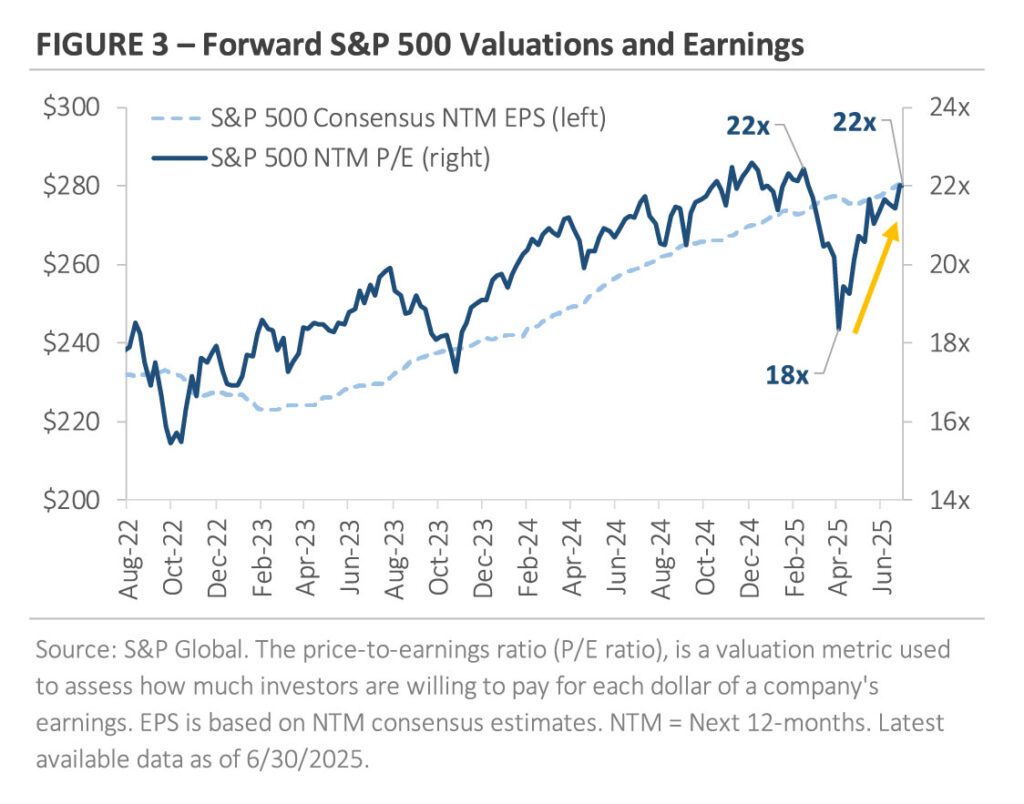
Figure 3 shows that the Q1 stock market selloff and subsequent Q2 rebound were primarily driven by changes in the S&P 500’s valuation. At the end of 2024, the S&P 500 traded at ~22x its forward earnings estimate. Investor optimism surrounding the new administration’s pro-growth policies and the future of artificial intelligence led investors to be willing to pay a higher valuation. However, the P/E multiple plunged to ~18x in early April after the administration unveiled new global tariffs, with investors worried about economic and earnings growth. As trade tensions eased in Q2 and investor sentiment improved, valuations recovered. By the end of June, the S&P 500 had traded at ~22 times its year-end value.
Stock market valuations can be sensitive to shifts in sentiment, and this year’s reversal underscores how conditions can change dramatically from one quarter to the next. The following section examines how the transition from P/E multiple contraction to expansion affected Q2 returns, resulting in Q1’s underperformers outperforming in Q2.
Equity Market Recap – S&P 500 Ends Q2 at Record High as Stocks Rebound from April Lows
The escalation in Q1 and de-escalation in Q2 created two distinct market environments. Figure 4 illustrates the year-to-date return paths for the low-volatility and high-beta factors, highlighting the two contrasting environments. Low-volatility portfolios typically hold stable and defensive stocks, such as utilities, consumer staples, and healthcare, which tend to outperform when market volatility increases. In contrast, high-beta stocks are more cyclical and sensitive to market movements, particularly in the industrial, financial, energy, and materials sectors. High-beta stocks tend to thrive in periods of strong economic growth and lower uncertainty. In short, the two factors are most effective in different market conditions.
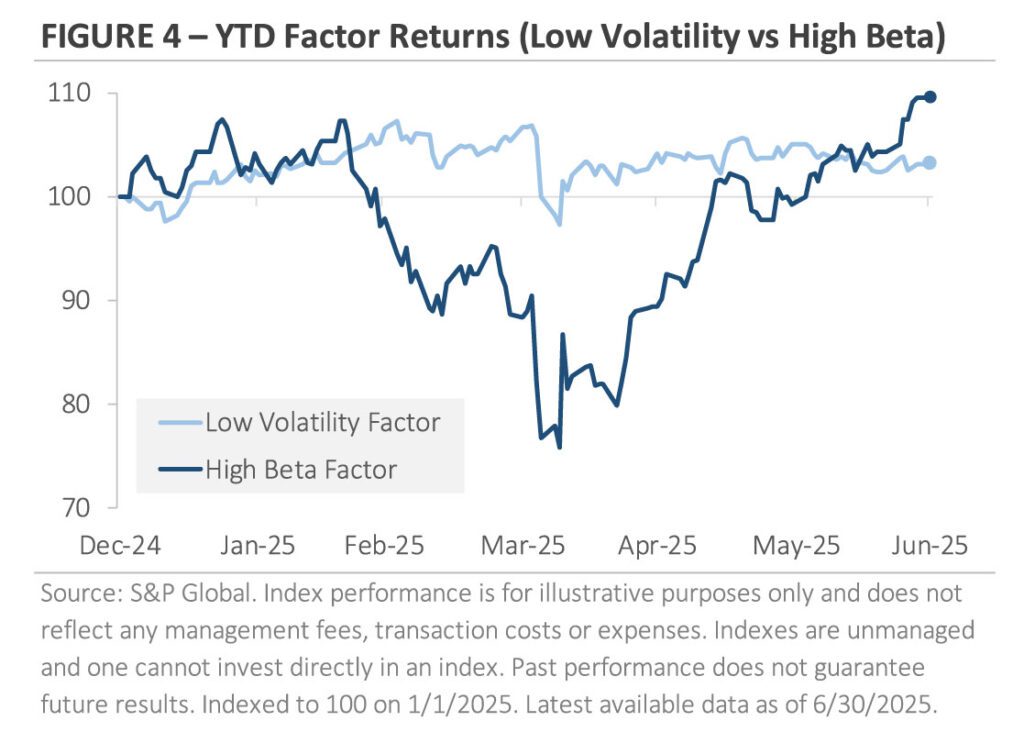
In Q1, low volatility outperformed high beta by nearly +20%, reflecting the market’s cautious tone. However, the right side of the chart shows an apparent trend reversal in the second quarter. The high beta factor outperformed low volatility by over 25% in Q2, erasing all its underperformance in Q1. The chart captures the broader theme of rapid escalation and de-escalation discussed throughout this market update.
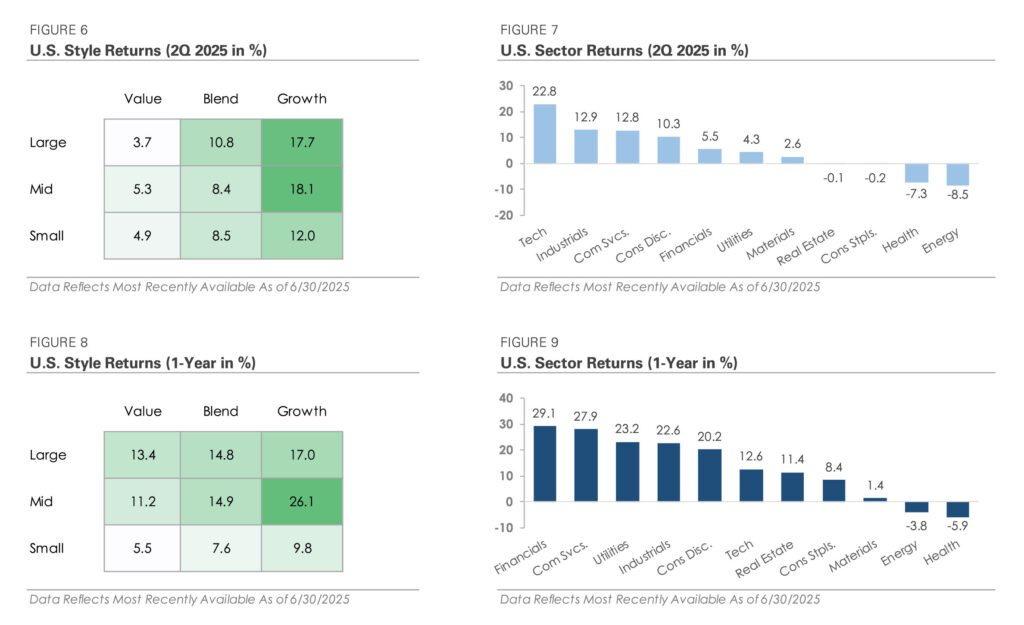
Stock market returns reveal a dramatic change in market leadership. Here’s a comparison of Q2 and Q1 returns. The S&P 500 rose +10.8% in Q2 after falling -4.3% in Q1, while small caps (Russell 2000) gained +8.5% after a -9.5% drop. Growth and tech stocks led the market reversal in Q2. The Russell 1000 Growth Index jumped +17.7% after a -10% Q1 decline, and the Nasdaq 100 gained +17.8% after an -8.1% loss. The “Magnificent 7,” a group of large-cap technology stocks, returned +21.0% after falling -15.7% in Q1. In contrast, the Russell 1000 Value Index posted muted gains, +3.7% in Q2 compared to Q1’s +2.1%. Defensive sectors that outperformed early in the year lagged as investors rotated toward riskier areas.
Despite the reversal from Q1 to Q2, one trend remained intact. International stocks outperformed U.S. stocks for a second straight quarter, with developed and emerging market stock indices both returning more than +11% in Q2. Year-to-date, developed and emerging market stocks have returned +20.2% and +16.4%, respectively, outperforming the S&P 500 by over +10%. Most of the outperformance can be attributed to a weaker U.S. dollar, which is being impacted by tariffs, policy uncertainty, and a rotation out of U.S. stocks into international stocks.
Credit Market Recap – Bonds Search for Direction
Like the stock market, the bond market experienced a significant shift in sentiment from the first quarter to the second quarter. Figure 5 graphs the 30-year U.S. Treasury yield since the start of the year. The 30-year yield was selected for its sensitivity to investor sentiment and economic forecasts. While Fed policy heavily impacts shorter-maturity Treasury yields, longer-maturity yields, such as the 30-year, are influenced by expectations for economic growth and inflation.
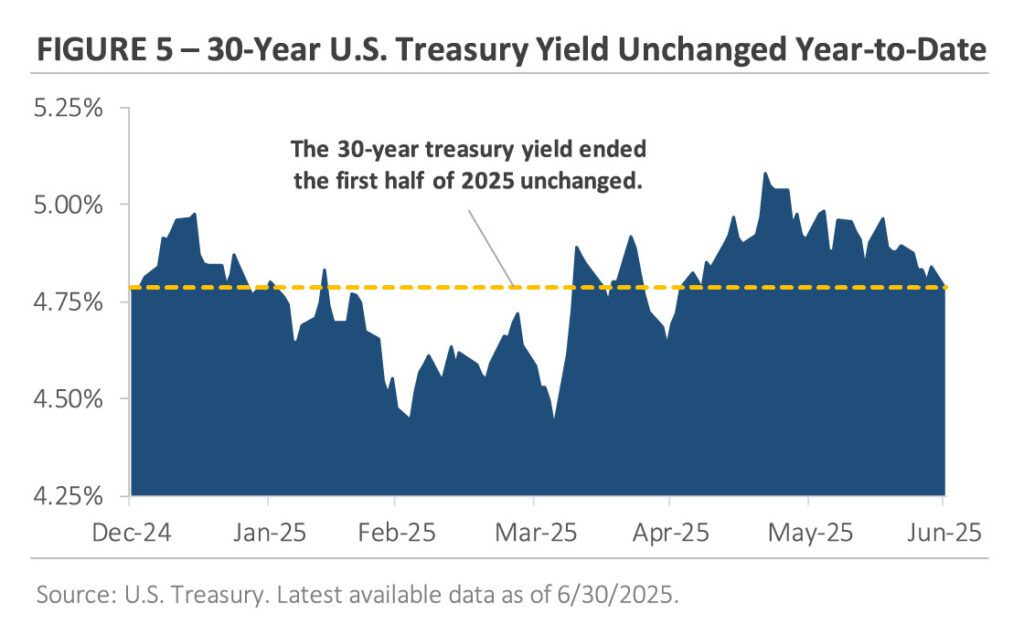
Figure 5 shows that the 30-year yield declined in Q1 amid rising policy uncertainty and concerns about slower economic growth. The combination prompted investors to move into longer-maturity Treasury bonds, driving the 30-year yield down from 4.80% at the end of 2024 to 4.40% in early April. However, the trend reversed in Q2, as market attention shifted from slower growth and policy uncertainty to worries about higher inflation and widening fiscal deficits. The 30-year yield peaked around 5.10% in late May before falling back to 4.79% by the end of June. Despite the volatility and changing narratives, the 30-year yield is mostly unchanged year-to-date.
Corporate bonds outperformed Treasury bonds in Q2, with lower-quality corporate bonds outperforming. Corporate bonds, particularly high-yield, benefited as tensions eased and investor sentiment improved, causing corporate credit spreads to tighten after they had widened in Q1. High yield produced a total return of +3.7%, outperforming investment grade’s +2% return after underperforming in Q1.
2025 Mid-Year Outlook – Staying Disciplined and Focusing on What You Can Control
At the start of the year, few could have anticipated the events and market volatility that would unfold over the first half of the year. The market’s early-year optimism was disrupted by policy-driven volatility, a dynamic that could persist in the second half of the year. However, despite policy uncertainty and market volatility, financial markets have proven to be resilient. In Q2, the S&P 500 posted its most substantial quarterly return since Q4 2023, fully reversing the Q1 selloff.
The rebound suggests the market believes the economic impact of tariffs will be modest and temporary. However, the economy is highly complex, and introducing trade policy volatility could have a range of implications. Tariffs could be short-lived, causing only minor disruptions as businesses and consumers adjust. In contrast, the cumulative effects of trade policy uncertainty could start to weigh on the broader economy in the second half of the year, leading to slower economic growth, weaker labor demand, and higher inflation. For now, markets seem to be pricing in a blend of the two scenarios: expecting growth to moderate later this year while remaining cautiously optimistic that the long-term effects will be limited.
The coming months will provide important context, with economic data and earnings reports capturing a period marked by both trade escalation and de-escalation. Corporate earnings commentary will shed light on how trade developments have affected business conditions, and companies will provide earnings guidance for the upcoming quarters. Second-quarter GDP growth is expected to be released in late July, offering insight into how shifting trade policy and tariffs have impacted the U.S. economy. Along the way, there will be additional trade policy developments, along with monthly economic data releases, to track the impact of tariffs on consumer spending, manufacturing activity, and the labor market.
Market volatility can be unsettling, but it’s a regular part of investing. Periods of enthusiasm often lead to recalibration. It’s natural to feel uncertain, but history shows that staying invested through volatility and maintaining a longer-term view is a prudent approach. By maintaining a diversified portfolio aligned with your long-term objectives, we are well-positioned to weather the market’s fluctuations.
With uncertainty on the horizon, the theme for the second half of 2025 is simple: focus on what you can control. It’s impossible to know what impact the tariffs will have on the global economy or whether the administration will change its mind on tariffs again. However, history shows the economy and market usually adapt to changing environments. Rather than reacting to headlines and market volatility, the best course of action is to stay focused on your financial plan, maintain a diversified portfolio, and make decisions in line with your long-term goals.